Data is Beautiful

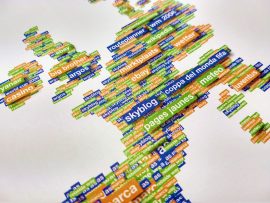
David McCandless’s book Information is Beautiful has become a must-have coffee table book for many. McCandless takes what can often be a dry and boring subject and turns it into a feast for the eyes, creating works of art from data. Who would have thought using the most popular search terms by country could produce such an interesting world map?
Data is often seen as dry and unnecessary—I mean, who can be bothered with all those numbers! But data can tell as much of a story as any case study. It can help you identify areas where you are strong; for instance, seeing which communities your project is drawing from to help you with advertising your services. It can also help identify areas where you are struggling; such as helping you identify at what point participants in your project may drop out and allowing you to make changes to keep your participants engaged.
For funders, data is often the way that they want to analyse the success of your projects; to see how effectively their money is being spent. Data helps give them an overview of your project and lets them know both if and when you complete the work that they’ve asked you to do. Without this data, it makes it very difficult to judge whether your work has been a success. You may also find it difficult to gain additional funding if you don’t have any evidence of who your project helps and how effective you as an organisation can be. Having a wealth of data that you can pull from can provide you with that evidence.
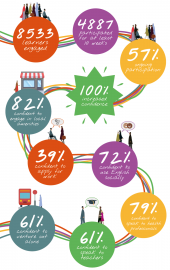
Data is a key component of FaithAction’s Creative English programme. Through the information that we collect from our hubs around the country, we can demonstrate the impact of the programme. We’ve seen over 10,000 people attend a Creative English class, with 100% of those who have attended 10 sessions stating they feel more confident speaking English—very impressive numbers indeed! But without the staff and volunteers of our hubs giving us that information, it would be very difficult for us to know the impact the programme was having on communities across the country. This data is also a very important part of the contract with our funder, the Ministry for Housing, Communities and Local Government, who also use it to assess the impact the programme is making.
But it’s not just about hard numbers. In preparation for writing a report recently, the team was analysing what motivates people to attend a Creative English class. The data we had collected from a sample of 4,600 learners showed that the motivation of the learners to join a class is most often linked to a desire to engage with their community, rather than for a personal aspiration of getting into work or moving onto further study. Without the data we collect from our hubs, we might not have been able to see this fascinating fact.
Looking after data can often seem a daunting and boring process. But data can show you things you never knew. Much like how McCandless’s book gives us a different way of viewing information through art, your data can show you a different way of looking at yourselves and your projects and can help you to continue to build yourselves and your organisations.
Data is beautiful.


